02-01-2026
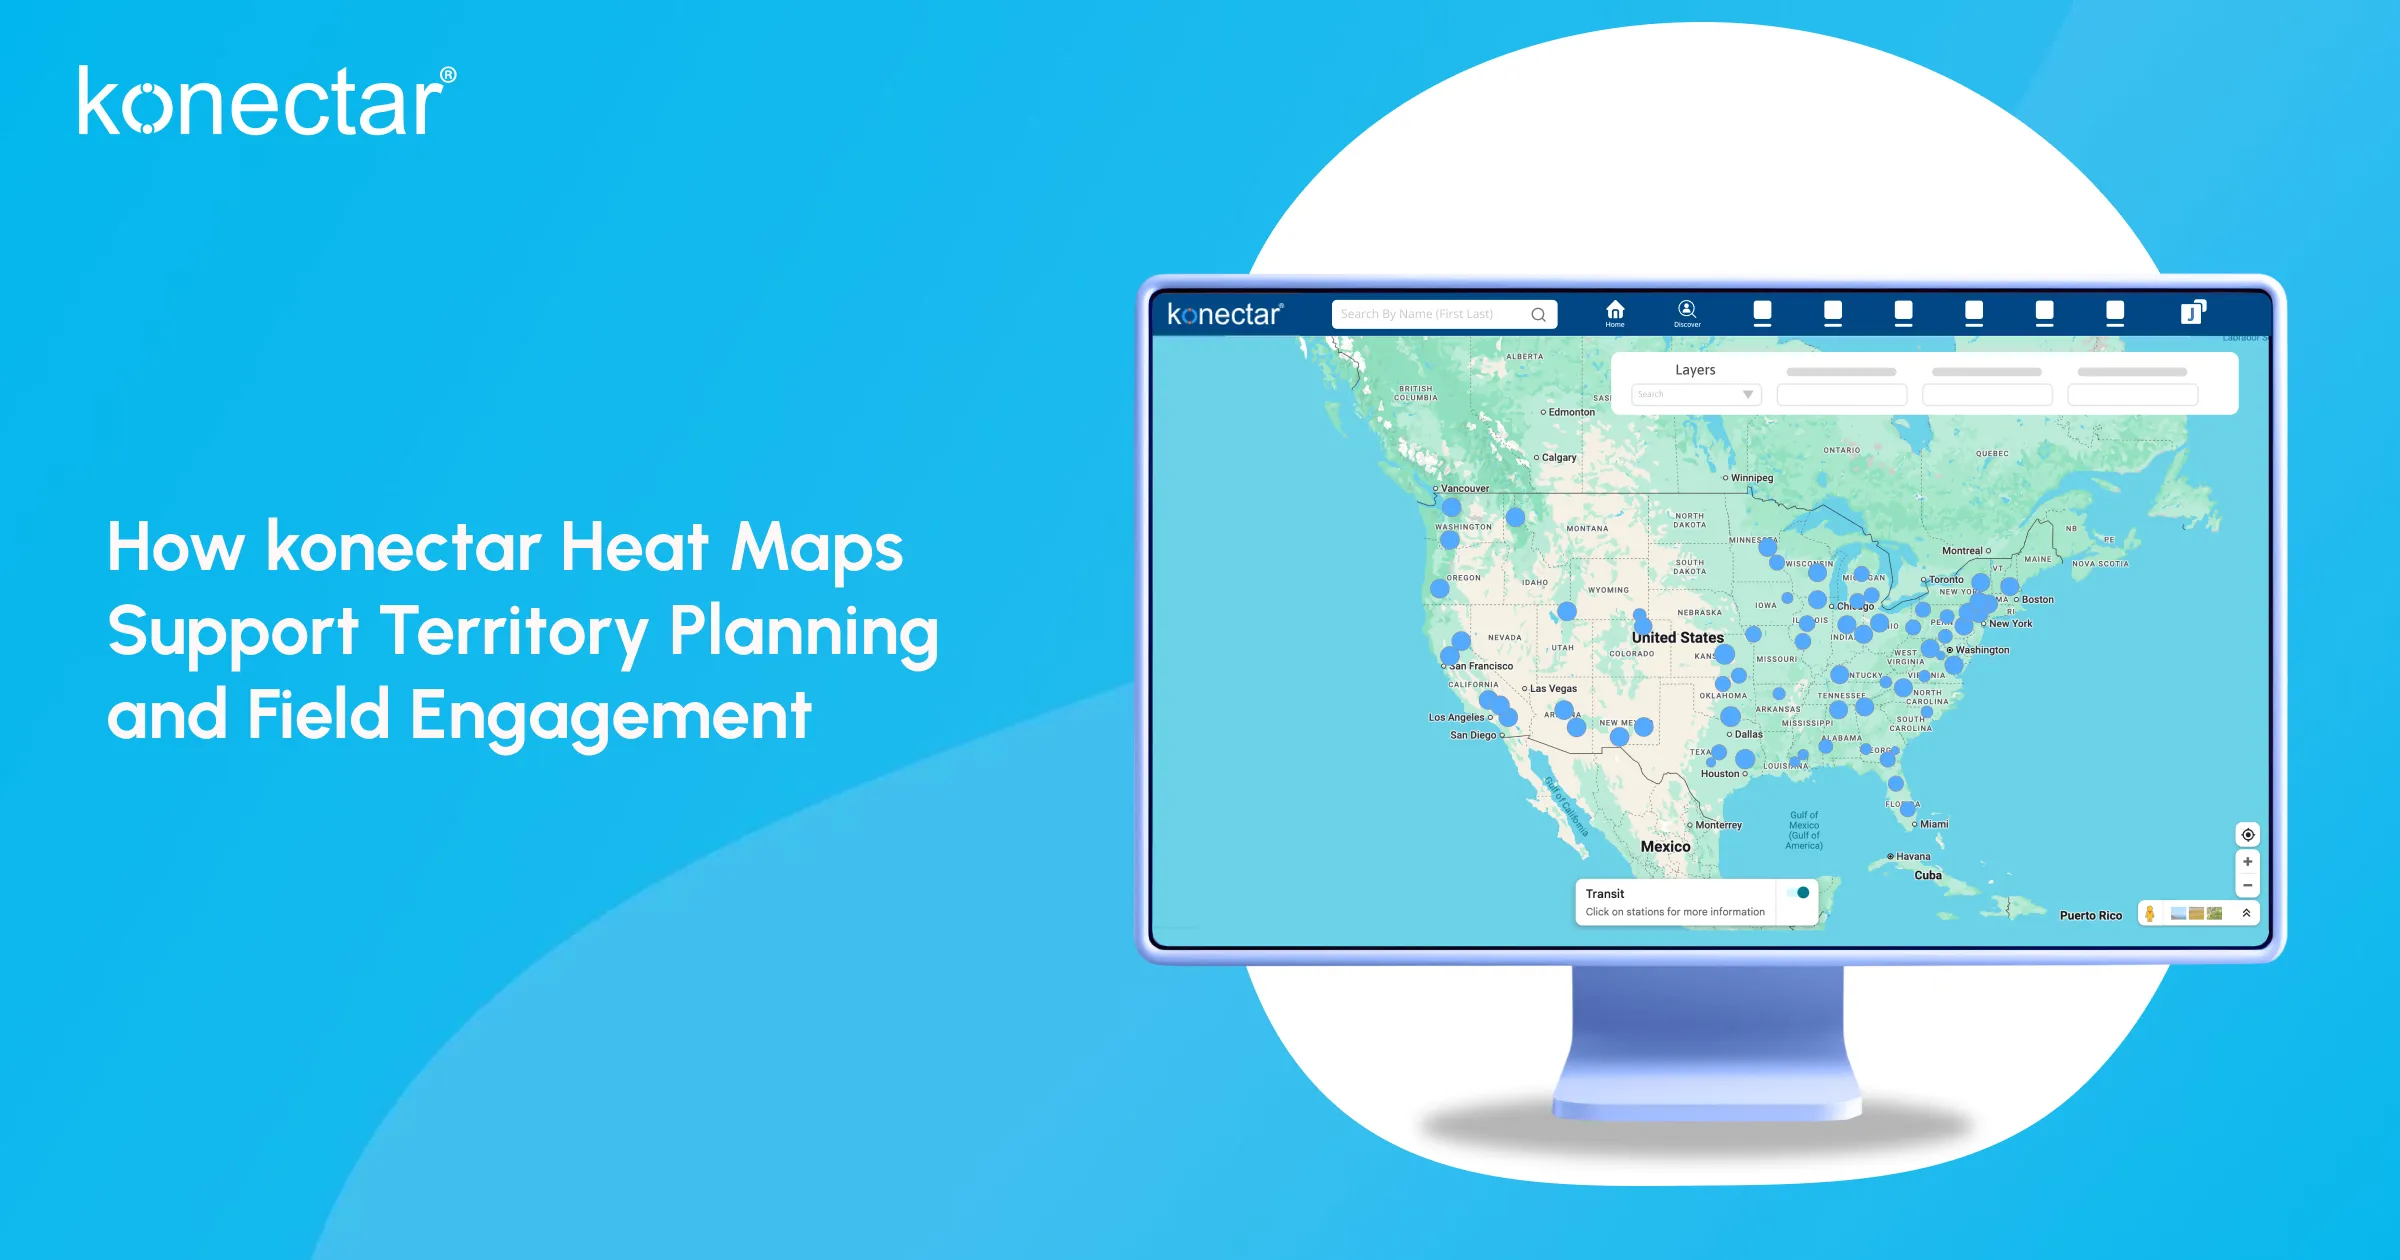
How konectar Heat Maps Support Territory Planning and Field Engagement
Field teams are under immense pressure to cover more HCPs with fewer resources. Territories that once made sense on spreadsheets quickly become misaligned with market dynamics as new specialists emerge or referral patterns shift, leading to uneven engagement. Without a clear geographic view, it’s hard to determine the next step.
konectar Heat Map turns that complexity into an actionable territory picture. Managers can see where coverage is thin, more or where effort is being duplicated. Instead of manually stitching together reports, field leaders can use heat maps to make fast, data-driven decisions about territory planning and engagement priorities.
In This Article
- What is konectar Heat Map
- Align Territories Using Real-Time HCP/HCO Density
- Optimize Field Coverage & Targeting
- Key Outcomes Clients See with konectar Heat Maps
- See konectar in Action
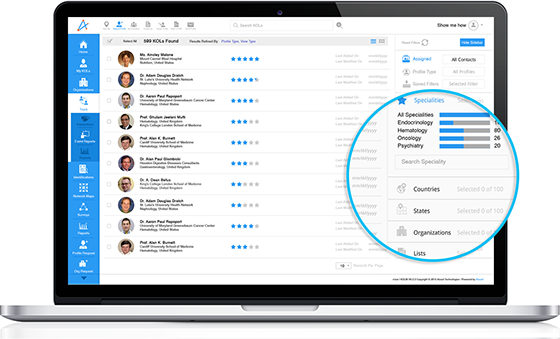
What is konectar Heat Map
konectar Heat Map delivers a live, map-based view of your HCP/HCO ecosystem. With an intuitive, interactive interface, it enables you to instantly visualize HCP distribution and easily refine your search by territory, specialty, or region, helping you gain clearer insights at a glance.
Align Territories Using Real-Time HCP/HCO Density
Effective territory planning begins with a clear understanding of where healthcare professionals and organizations are actually located. A real-time, map-based view helps leaders identify areas of high and low concentration, making it easier to recognize dense clusters as well as underrepresented regions.
For example, managers can focus on a specific specialty within a territory and quickly assess whether coverage is balanced or fragmented. This enables teams to use the dynamic visual insights to guide smarter territory alignment and eliminate overlap.
Optimize Field Coverage & Targeting
When teams can see how field activity aligns with target regions or segments, optimizing coverage becomes more straightforward. By comparing activity levels across regions, teams can uncover high-potential accounts that have not yet been fully engaged, as well as areas where effort may not be delivering expected results. This clarity enables more informed decisions and better allocation of resources.
Key Outcomes Clients See with konectar Heat Maps
Teams that adopt konectar typically move from intuition-based planning to a more measurable approach to territory and engagement planning. In addition, when issues appear, such as persistent under-engagement of a specific specialty or region, they are easier to address because the underlying patterns are already visible on the map.
This gives teams a more objective foundation for territory planning, reducing dependence on historical performance alone and enabling decisions based on current, data-driven insights.
See konectar in Action
The best way to understand the value of a Heat Map is through a live walkthrough. It enables stakeholders to explore real scenarios, ask practical questions, and see clear answers unfold directly on the screen in real time.
If you are preparing for an upcoming planning cycle or evaluating changes to your field structure, this is an ideal moment to explore how konectar can support those decisions. A focused session with your data in the platform can highlight immediate opportunities to refine targeting and strengthen field execution.
To take the next step, connect with our team to schedule a demo or discuss how konectar can be configured to match your current requirements.